How to Create Client Reports That Actually Get Read
Learn how to create client reports that clients actually read and value. Discover report structure best practices, AI summaries, and visual design tips

You spend hours compiling data, crafting insights, and formatting your client reports. Then you send them off into the void, never quite sure if anyone actually reads them. Sound familiar?
The harsh truth is that most client reports go unread. They arrive in crowded inboxes, get filed away with good intentions, and are forgotten within hours. This isn't because your clients don't care about the results you're delivering. It's because your reports aren't designed to be read.
What Clients Want vs What Agencies Send
Clients want answers to simple questions. Is my website getting more visitors? Are we getting more leads? Is our marketing investment paying off? They want these answers quickly, clearly, and without needing a degree in analytics.
Most agencies send dense documents filled with charts, tables, and metrics that require significant effort to interpret. The disconnect is obvious. Your client has five minutes to review your report before their next meeting. Your report requires twenty minutes to understand. It doesn't get read.
The solution isn't to dumb down your reports or remove valuable data. It's to restructure them so the most important information is immediately visible, while detailed data is available for those who want to dig deeper.
The Executive Summary Principle
Every client report should start with an executive summary that can be read in under two minutes. This summary should answer the core questions your client cares about, provide clear numerical comparisons to previous periods, and highlight the most significant changes.
Your executive summary might look like this: "Website traffic increased 23% this month, driven primarily by improved organic search performance. Lead generation remained steady at 47 conversions. Mobile traffic now represents 68% of total visits, up from 61% last month. Key recommendation: optimize the contact form for mobile users to capitalize on this traffic shift."
Notice what this accomplishes. In four sentences, you've communicated growth, identified the source, highlighted a trend, and provided an actionable recommendation. Your client now understands the essential story, even if they never scroll further.
Structure for Scanability
After your executive summary, structure your report so it can be scanned rather than read linearly. Use clear section headers that communicate the content at a glance. "Traffic Overview" tells your client exactly what they'll find. "Performance by Traffic Source" does the same.
Within each section, lead with the conclusion. Don't make your client wade through paragraphs of setup to discover that organic traffic increased. Start with "Organic traffic increased 18% to 4,523 visitors," then provide context and explanation.
Use subheadings liberally. If your traffic overview section is more than a few paragraphs, break it into subsections: Overall Traffic, Traffic Sources, Geographic Distribution, Device Types. This lets clients jump directly to what interests them most.
Visual Hierarchy and Data Presentation
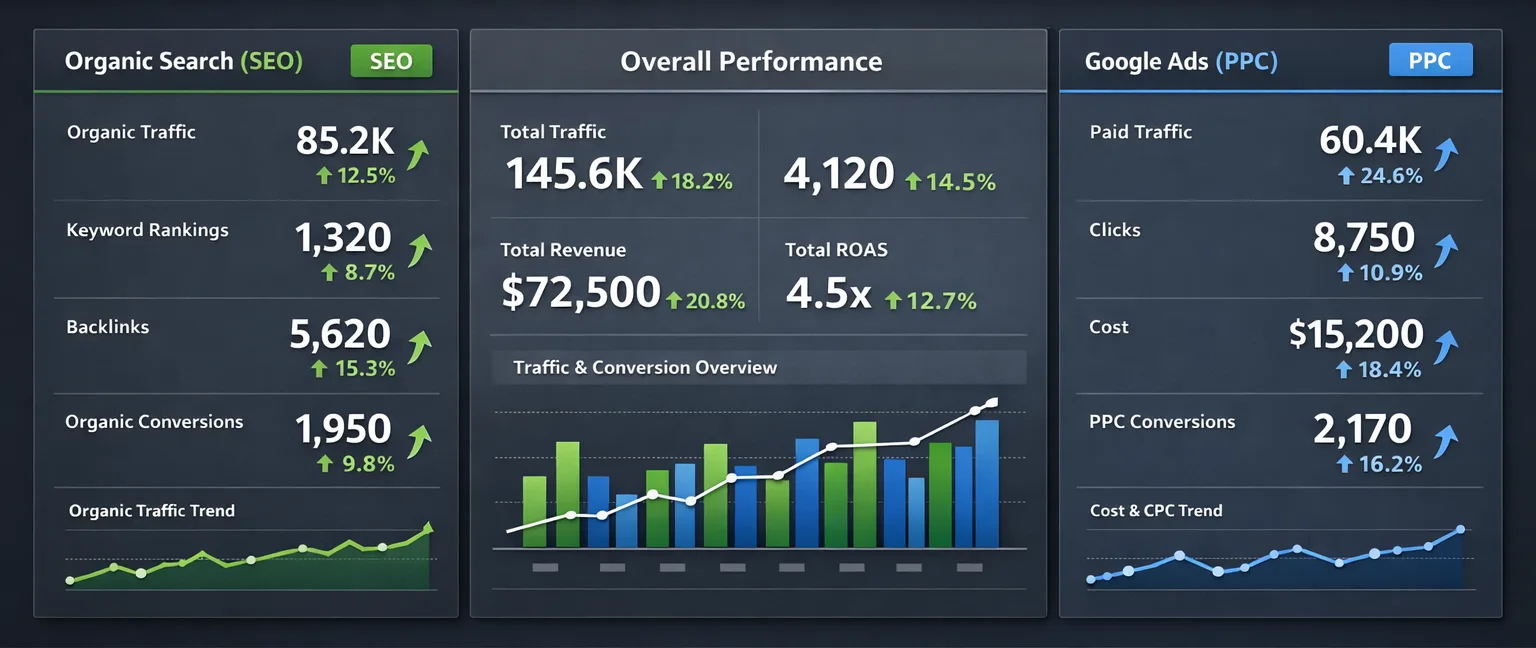
Numbers presented in tables are hard to interpret quickly. Numbers presented visually in charts and graphs communicate instantly. A line graph showing traffic trends over six months tells a story at a glance. A table of the same data requires mental effort to extract meaning.
Every metric that shows change over time should be visualized as a line graph. Traffic, conversions, engagement—these all benefit from visual representation. Use bar charts to compare categories, like traffic from different sources or performance of different pages.
Color code your charts to reinforce meaning. Green for positive changes, red for negative changes, gray for neutral metrics. This lets clients identify good news and concerns without reading a single word.
But be judicious with visuals. Too many charts create visual clutter that's as bad as too much text. Each chart should have a clear purpose and tell a specific part of your story.
Writing for Clarity, Not Impressiveness
Marketing reports are not the place to demonstrate your mastery of analytics jargon. Every sentence should be immediately understandable to someone without a marketing background.
Replace "bounce rate decreased from 67% to 58%" with "more visitors are staying on the site and exploring multiple pages." Instead of "organic CTR improved 3.2 percentage points," write "more people are clicking on your site in Google search results."
This doesn't mean patronizing your client or oversimplifying complex concepts. It means prioritizing communication over terminology. When technical terms are necessary, define them clearly the first time you use them.
The Problem with Too Much Data
More data doesn't make a better report. It makes a more intimidating report that's less likely to be read. Be ruthless about including only metrics that matter to your client's specific business goals.
If your client runs an e-commerce site, they care about transactions and revenue. If they run a lead generation business, they care about form submissions and phone calls. If they publish content, they care about page views and engagement time. Focus your report on the metrics that directly relate to their success.
Secondary metrics can be included in appendices or supplementary sections for clients who want to dig deeper, but they shouldn't clutter your primary narrative.
Using AI to Generate Executive Summaries
Writing compelling executive summaries is time-consuming, especially when you're managing multiple clients with different reporting needs. This is where AI-powered summaries can dramatically improve both efficiency and consistency.
Modern reporting tools can analyze your data and automatically generate summaries that highlight significant changes and trends. These AI summaries provide a solid foundation that you can refine with your strategic insights and recommendations.
The key advantage isn't just time savings. AI summaries eliminate the risk of overlooking important changes when you're rushing to meet reporting deadlines. The algorithm catches every significant metric shift, ensuring nothing important gets lost in the shuffle.
Branding and Professional Presentation
Your reports should look like they came from your agency, not from a generic template. This means incorporating your logo, using your brand colors, and maintaining consistent formatting that matches your other client deliverables.
Professional presentation signals quality and attention to detail. It reinforces your position as a premium service provider rather than a commodity vendor. Clients notice these details, even if they don't consciously register them.
Consistency matters too. Every report should follow the same structure and design language. This builds familiarity and makes your reports easier to navigate over time.
Making Reports Actionable
Data without recommendations is just information. Clients hire you for expertise, not data compilation. Every section of your report should lead to clear, actionable recommendations.
If organic traffic increased, recommend creating more content in the same vein. If mobile traffic is growing but conversions aren't, recommend mobile optimization work. If certain pages have high traffic but low engagement, suggest content improvements or A/B testing.
These recommendations don't need to be extensive—a sentence or two per section is often sufficient. But they transform your report from a status update into a strategic document that drives decision-making.
The Delivery Method Matters
How you deliver reports affects whether they get read. Email attachments often go unnoticed in busy inboxes. Secure client portals create friction that reduces access. Links to reports in cloud storage get lost in email threads.
The best approach is consistent delivery on a predictable schedule. If your client expects their report on the first Tuesday of every month, and it arrives reliably at that time, they're much more likely to engage with it.
Consider including a brief email summary with the key highlights when you send the full report. This gives time-pressed clients the essential information immediately while providing access to deeper details when they have time.
Length and Detail Balance
There's no magic length for client reports, but there is a balance to strike. Too short and the report feels insubstantial, like you haven't done much work. Too long and it won't get read.
For most monthly retainers, reports between three and six pages hit the sweet spot. This allows for an executive summary, detailed sections on traffic and conversions, and your strategic recommendations, without overwhelming busy clients.
For more significant engagements or quarterly reviews, longer reports are appropriate. But even these should follow the same structural principles: executive summary up front, scannable sections, visual data presentation, and clear recommendations.
Testing and Iteration
The only way to know if your reports are working is to ask. Check in with clients after a few months and get honest feedback. Are they reading the reports? What sections do they focus on? What would they like to see more or less of?
Be prepared for variation. Some clients want extensive detail and will request additional metrics. Others want the bare essentials and might ask you to simplify further. The willingness to adapt your reporting to individual client preferences demonstrates that you're truly focused on their needs.
The ROI of Better Reports
Improving your client reporting isn't just about making documents more readable. Better reports lead to better client relationships, which lead to longer retention and more referrals.
When clients can clearly see the value you're delivering, they're more likely to renew contracts and expand services. When reports are professional and insightful, clients view your agency as strategic partners rather than vendors.
The time you invest in creating better report structures pays dividends in client satisfaction and agency growth.
Create Reports Your Clients Will Actually Read
Sonrai generates professional, branded client reports with AI-powered executive summaries that highlight the most important changes automatically. Your reports will be consistent, scannable, and focused on the metrics that matter most to each client.
Start your free trial and see how better reports can strengthen your client relationships.