Google Search Console Metrics Every Agency Should Report On
If you're only reporting on Google Analytics data, you're telling half the story. Google Search Console provides critical insights into how your clients' websites perform in search results
Yet many agencies either skip Search Console reporting entirely or include it superficially, usually because they're not sure which metrics matter or how to explain them to non-technical clients. This is a missed opportunity, because Search Console data directly demonstrates SEO value in ways that resonate with clients.
Why Search Console Matters for Client Reports
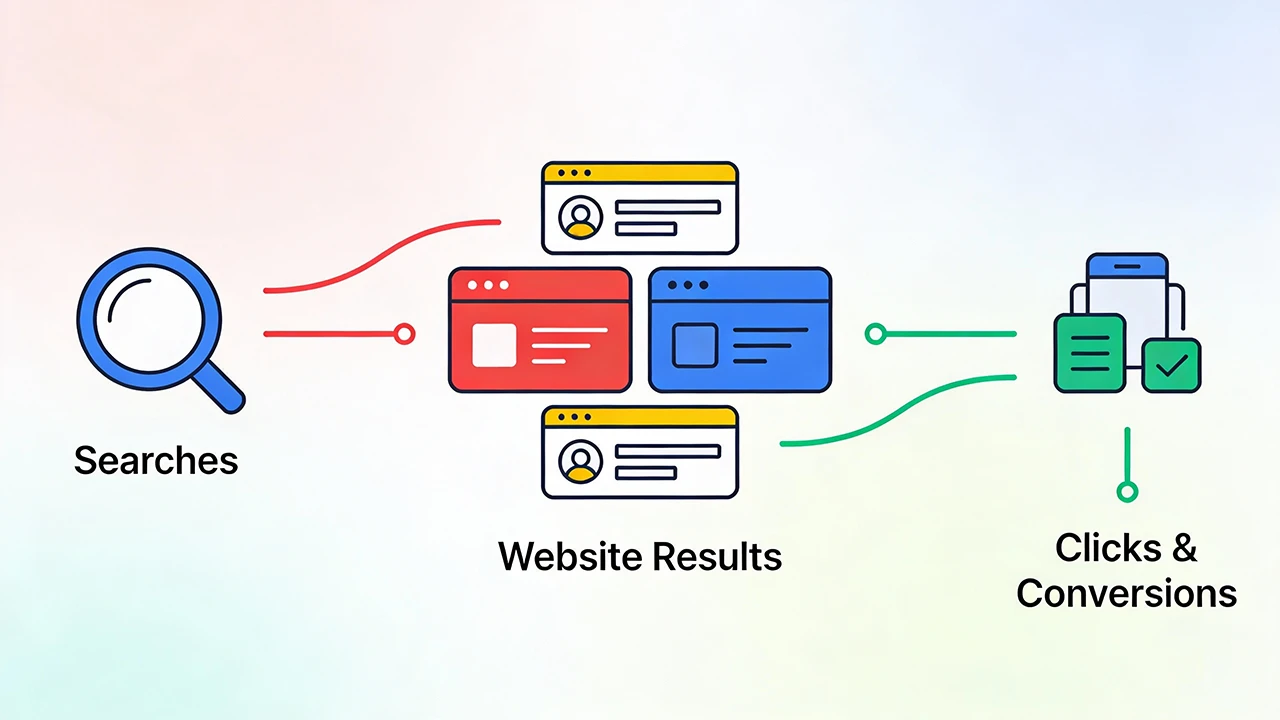
Google Analytics tells you what happened after people reached your client's website. Search Console tells you what happened before that, in Google's search results. It answers critical questions: Which searches are showing your client's site? How often do people click when they see the listing? How are rankings changing over time?
This data is particularly valuable for justifying SEO retainers. When a client questions the value of ongoing SEO work, Search Console data shows concrete improvements in visibility, rankings, and search traffic that directly result from your efforts.
The Four Core Search Console Metrics
Search Console provides numerous data points, but four metrics form the foundation of effective reporting: clicks, impressions, click-through rate, and average position. Understanding these metrics and their relationships is essential for meaningful client reporting.
Clicks represent the number of times users clicked through to your client's site from Google search results. This is the most tangible metric—actual visitors arriving via organic search. Clicks directly correlate with traffic your client can see in their analytics platform.
Impressions show how many times your client's site appeared in search results, regardless of whether anyone clicked. This is your visibility metric. High impressions mean strong presence in search results. Low impressions suggest limited visibility for relevant searches.
Click-Through Rate (CTR) is the percentage of impressions that resulted in clicks. It's calculated as clicks divided by impressions. CTR indicates how compelling your client's search listings are. A low CTR suggests that even when the site appears in results, users aren't motivated to click.
Average Position shows where your client's site typically ranks in search results for queries that generated impressions. Position 1 means first result, position 10 means bottom of the first page, position 20 means second page. Lower numbers are better—they indicate higher rankings.
Understanding the Relationship Between Metrics
These four metrics don't exist in isolation. Understanding how they interact helps you tell more nuanced stories about SEO performance.
Rising impressions with declining CTR might indicate that the site is ranking for broader, less targeted terms where listings aren't as compelling. Rising position with stable clicks suggests you're maintaining traffic while improving efficiency—ranking higher for fewer queries rather than ranking lower for more queries.
Stable impressions with increasing clicks means improved CTR, often resulting from better title tags and meta descriptions. This is valuable because you're getting more traffic without needing to rank for additional keywords.
Which Metrics to Prioritize for Different Client Types
Not all clients should focus on the same Search Console metrics. Reporting priorities depend on business model and current performance.
For established sites with strong existing rankings, focus on clicks and CTR. These clients care about maximizing the value of their existing visibility. Show them how optimizing titles and descriptions is increasing click rates, or how content improvements are boosting traffic for high-value keywords.
For newer sites or those recovering from penalties, prioritize impressions and average position. These clients need to see visibility improvements. Show growing impressions as evidence that Google is starting to recognize the site for relevant queries. Show improving position as proof that rankings are climbing.
For e-commerce sites, connect Search Console data to revenue. Show which product categories are gaining visibility, which search terms are driving traffic, and estimate the revenue value of improved rankings for high-intent keywords.
Explaining Search Console Data to Clients
Most clients don't think in terms of impressions and CTR. They think in terms of business outcomes. Your job is to translate the data into language that connects with their goals.
Instead of saying "Impressions increased 34% to 18,500," explain what that means: "Your site appeared in Google search results 18,500 times this month, up 34% from last month. This means more people are seeing your business when searching for relevant services."
Rather than reporting "Average position improved from 8.2 to 6.4," clarify the significance: "Your site is now ranking on average near the middle of Google's first page, up from near the bottom. This puts you in front of more potential customers before they see competitors."
Top Queries: The Most Valuable Search Console Data
The queries report in Search Console shows which specific searches triggered your client's site in results. This is goldmine data for demonstrating SEO value and identifying opportunities.
When reporting top queries, focus on changes over time. Which queries are showing the biggest gains in impressions, clicks, or position? These represent your SEO wins. Which valuable queries have high impressions but low CTR? These represent optimization opportunities.
Group queries by theme when reporting. Instead of listing 50 individual queries, group them into categories: product queries, service queries, location queries, informational queries. This makes the data more digestible and helps clients understand the breadth of their search visibility.
Pages Report: Understanding Content Performance
The pages report shows which URLs on your client's site appear most frequently in search results. This data reveals which content is earning visibility and which is underperforming.
When reporting on top pages, connect the data to business goals. If your client's highest-impression page is their blog rather than their services page, that might indicate a strategic problem. If product pages are earning lots of impressions but few clicks, that suggests listings need optimization.
Look for pages with high potential but low performance. Pages with decent impressions but poor CTR are prime candidates for title and description optimization. Pages with improving position but declining clicks might indicate increased competition.
Countries and Devices: Understanding Your Audience
The countries and devices reports provide demographic context that helps clients understand their search audience better.
Device data is particularly valuable. If mobile impressions and clicks are growing faster than desktop, your client needs mobile optimization. If mobile CTR is lower than desktop CTR, mobile listings might need better optimization, or the mobile site experience might be poor.
Geographic data matters for local businesses and businesses with regional strategies. If your client serves specific areas, show Search Console data for those regions. If unexpected geographic areas show strong performance, that might reveal business opportunities.
Connecting Search Console to Other Platforms
Search Console data becomes more powerful when connected to other reporting sources. Combining Search Console with Google Analytics shows the complete journey from search impression to website conversion.
For example, Search Console shows increasing clicks from organic search. Google Analytics shows what those visitors do on the site—which pages they visit, how long they stay, whether they convert. Together, these platforms tell the complete story of SEO performance and business impact.
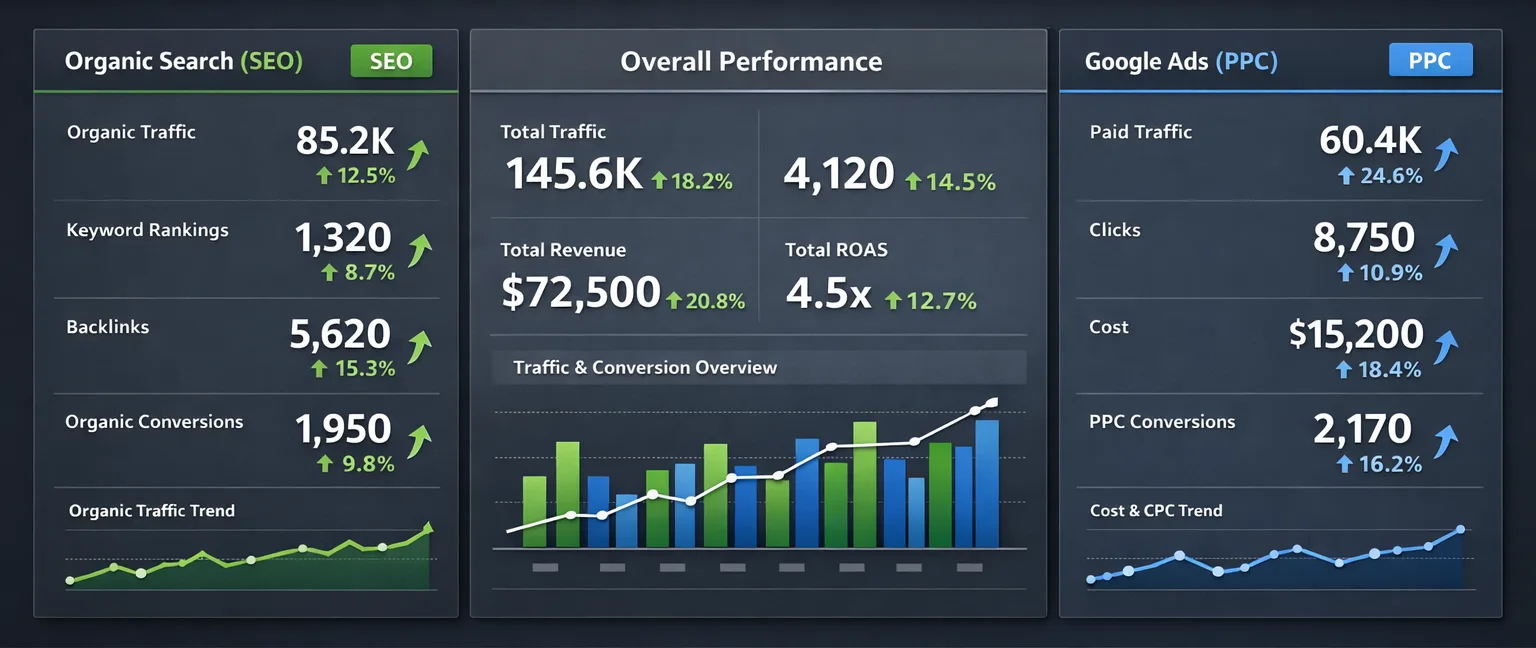
Similarly, combining Search Console with Google Ads data lets you identify opportunities to shift budget from paid to organic, or to identify high-value keywords worth targeting with both channels.
Common Search Console Reporting Mistakes
Several pitfalls catch agencies when reporting Search Console data. Avoiding these ensures accurate, meaningful reports.
Don't compare date ranges with different lengths. Search Console lets you select custom date ranges, but comparing a 30-day period to a 28-day period skews percentages. Always use consistent timeframes or normalize the data.
Be aware of data processing delays. Search Console data can lag by two to three days. If you pull reports too soon after month end, recent data might be missing or incomplete. Wait a few days for complete data before finalizing reports.
Understand filtered versus unfiltered data. When you filter Search Console data by query, page, or country, the metrics shown are specific to that filter. The sum of filtered data won't equal your total metrics because most queries, pages, and countries appear in multiple combinations.
What Success Looks Like in Search Console
Setting clear benchmarks helps clients understand whether performance is strong, weak, or improving. Context matters enormously for Search Console metrics.
CTR varies dramatically by industry and query type. Average CTR across all queries is typically 2-5%, but branded queries might see 20-40% CTR while generic informational queries might be below 1%. Compare your client's CTR to their historical performance and industry benchmarks.
Position is similarly contextual. Position 3-4 is excellent for highly competitive terms, while position 8-10 might be poor for niche, low-competition queries. Focus on position trends rather than absolute numbers.
Impressions growth is generally positive, but quality matters. Growing impressions for irrelevant queries doesn't help business outcomes. Focus on impression growth for queries aligned with client goals.
Creating Actionable Search Console Reports
Raw Search Console data is interesting, but actionable insights are valuable. Every section of your Search Console reporting should lead to clear recommendations.
If certain queries have high impressions but low CTR, recommend optimizing titles and descriptions for those specific search terms. If valuable pages have poor rankings, recommend content improvements or link building focused on those pages. If mobile CTR lags desktop, recommend mobile site improvements.
Connect these recommendations to business outcomes. Don't just say "optimize mobile listings." Say "improving mobile CTR from 2.1% to 3.5% would generate approximately 280 additional monthly visitors based on current impression volume."
Frequency and Format for Search Console Reporting
For most clients, Search Console data fits naturally into monthly reporting alongside Google Analytics. The data doesn't change rapidly enough to warrant weekly reporting, but monthly snapshots effectively show trends and improvements.
Present Search Console data visually wherever possible. Line graphs showing clicks and impressions over time communicate trends more effectively than tables of numbers. Bar charts comparing CTR across top queries help identify optimization opportunities at a glance.
Automate Your Search Console Reporting
Sonrai connects to Google Search Console and automatically pulls clicks, impressions, CTR, and position data into your client reports. See query performance, page performance, and trends over time without manual data compilation.
Start your free trial and simplify your Search Console reporting.