The Complete Guide to GA4 Reporting for Agencies
Master GA4 reporting for your agency clients. Learn key metrics, reporting best practices, and how to explain Google Analytics 4 data effectively.
Google Analytics 4 has been mandatory since July 2023, when Universal Analytics stopped processing data. If you're still figuring out how to report on GA4 data to your clients, you're not alone. The platform represents a fundamental shift in how Google tracks and reports website analytics.
Understanding the GA4 Difference
Universal Analytics tracked sessions and pageviews. GA4 tracks events and engagement. This isn't just a terminology change—it's a completely different data model that requires agencies to rethink their reporting approach.
In Universal Analytics, everything revolved around the session. A user visited your site, viewed some pages, and their session ended after 30 minutes of inactivity. Reporting was straightforward because the metrics matched how people naturally think about website visits.
GA4 abandons this model in favor of event-based tracking. Every interaction is an event: page views, clicks, scrolls, video plays, form submissions. This provides much more granular data, but it also makes reporting more complex.
Key GA4 Metrics Agencies Should Track
Let's establish the essential metrics you should include in every client report, and more importantly, what they actually mean.
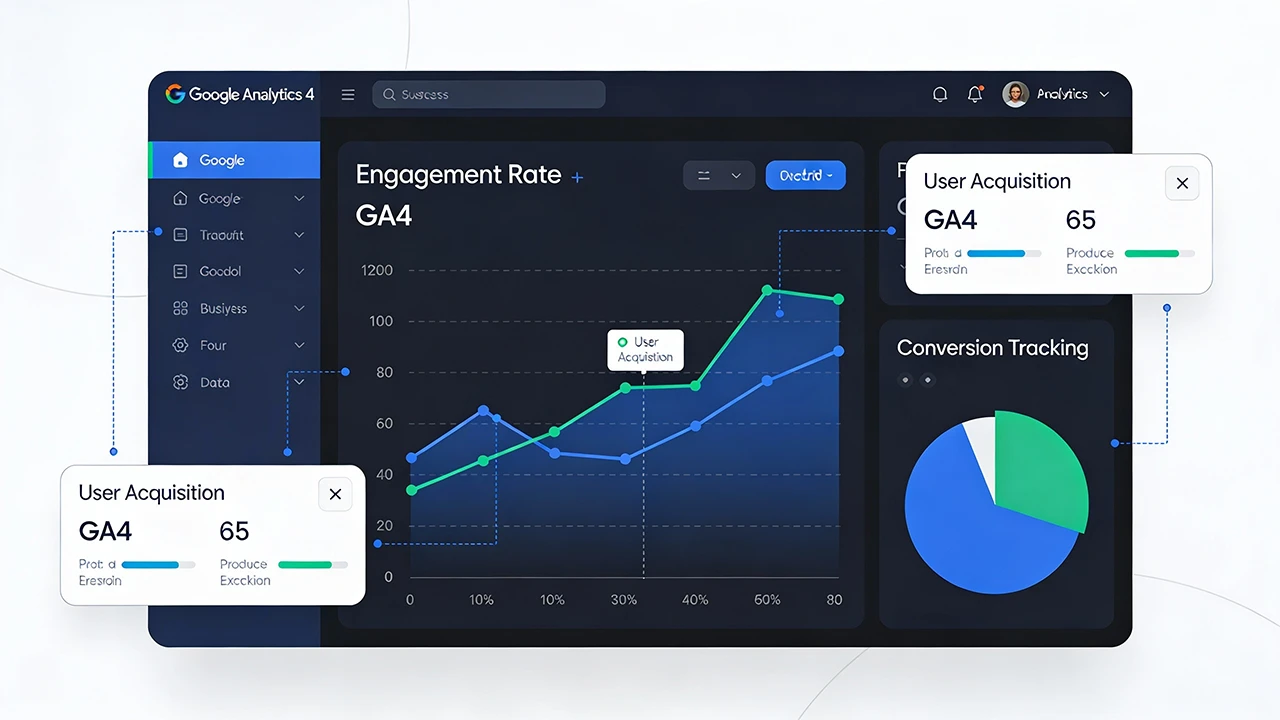
Users and Sessions: The fundamental reason we do this. Users represent unique visitors, while sessions represent individual visits. GA4 now distinguishes between "Total Users" and "Active Users," with active users being those who had an engaged session or triggered specific events.
Engagement Rate: This replaces bounce rate as the primary engagement metric. Instead of measuring the percentage of single-page sessions, engagement rate shows the percentage of sessions that lasted longer than 10 seconds, had a conversion event, or included two or more page views. This is a much more useful metric for understanding real engagement.
Average Engagement Time: AET tells you how long users are actively engaging with content. Unlike session duration in Universal Analytics, this metric only counts time when the page is in focus, providing a more accurate picture of genuine engagement.
Conversions: Put simply, conversions in GA4 are simply events you've marked as important. This could be form submissions, purchases, phone calls, or any other action that matters to your client's business. The flexibility is powerful, but it also means you need to ensure conversions are properly configured.
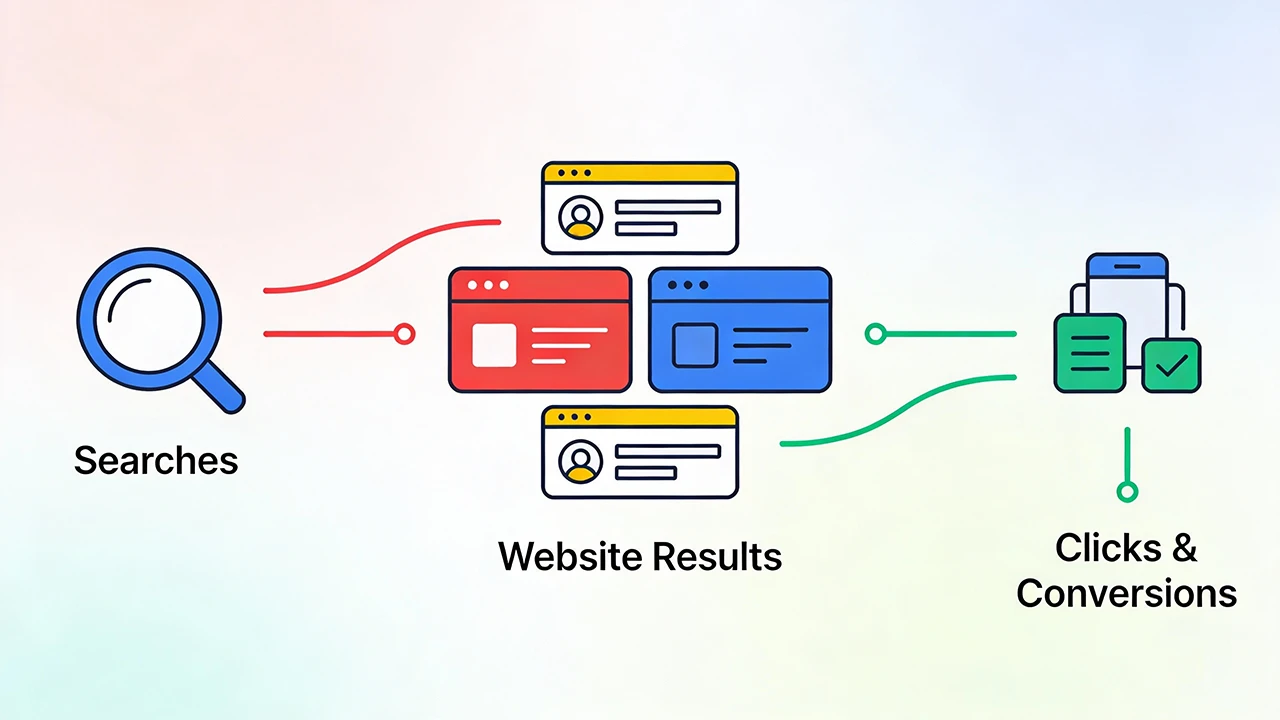
Traffic Acquisition: This metric shows where users first discovered the site, while User Acquisition
Reporting on GA4 Data Effectively
Raw numbers mean nothing without context. Your clients don't care that they had 5,847 users last month unless you tell them whether that's good, bad, or unchanged from previous periods.
Always include comparison periods in your reports. Month-over-month comparisons help identify trends, while year-over-year comparisons account for seasonal fluctuations. A retail client might see a natural spike in November—that's not necessarily a result of your marketing efforts, and you need to show historical data to provide context.
Use visual representations wherever possible. A line graph showing traffic trends over the past six months communicates more effectively than a table of numbers. Bar charts comparing traffic sources help clients quickly identify their most valuable channels.
Explaining GA4 Data to Non-Technical Clients
Most clients don't understand analytics terminology, and they don't need to. Your job is to translate data into business insights they can act on.
Instead of saying "Engagement rate increased from 68% to 74%," explain what that means: "More visitors are spending meaningful time on your site rather than immediately leaving. This suggests your content is resonating with the right audience."
When discussing traffic sources, use plain language. "Organic Search" becomes "visitors who found you through Google." "Direct" becomes "visitors who typed your web address directly or clicked a bookmark." Remove the jargon barrier and your reports become dramatically more useful.
Common GA4 Reporting Challenges
Several GA4 quirks catch agencies by surprise. Understanding these helps you set appropriate client expectations and avoid confusion.
Data in GA4 doesn't match Universal Analytics historical data. This isn't an error—it's because the platforms measure things differently. When clients ask why their traffic "dropped" after switching to GA4, explain that you're comparing apples to oranges. The methodologies are fundamentally different.
GA4 uses data sampling more aggressively than Universal Analytics. For high-traffic sites, reports might show estimates rather than exact figures. This is usually fine for identifying trends, but worth mentioning to clients who scrutinize every number.
Real-time data in GA4 takes longer to fully process. If you're pulling reports immediately after month-end, some data might still be processing. Wait 24-48 hours for complete data before finalizing reports.
Setting Up GA4 for Better Reporting
Your reports are only as good as your GA4 configuration. Take time to set up proper conversion tracking, custom events, and user properties before you start reporting.
Conversions should align with your client's business goals. For e-commerce, that's obviously purchases. For lead generation, it might be form submissions or phone calls. For content sites, it could be newsletter signups or time-on-page thresholds. Configure these early so you have historical data to report on.
Custom events let you track specific user behaviors relevant to your client's business. Maybe you want to track clicks on specific buttons, downloads of PDFs, or video completion rates. These custom events make your reports more relevant and valuable.
Integrating GA4 Reports with Other Data Sources
GA4 data is powerful, but it's only part of the story. The most valuable agency reports combine GA4 data with Google Search Console, Google Ads, and other platforms to show the complete picture.
For example, GA4 shows you had 10,000 organic visitors last month. Google Search Console shows you which search queries drove that traffic and how your rankings changed. Combined, these data sources tell a much richer story than either could alone.
Similarly, GA4 shows conversion rates, while Google Ads shows cost per conversion. Bringing these together demonstrates ROI in a way that resonates with clients.
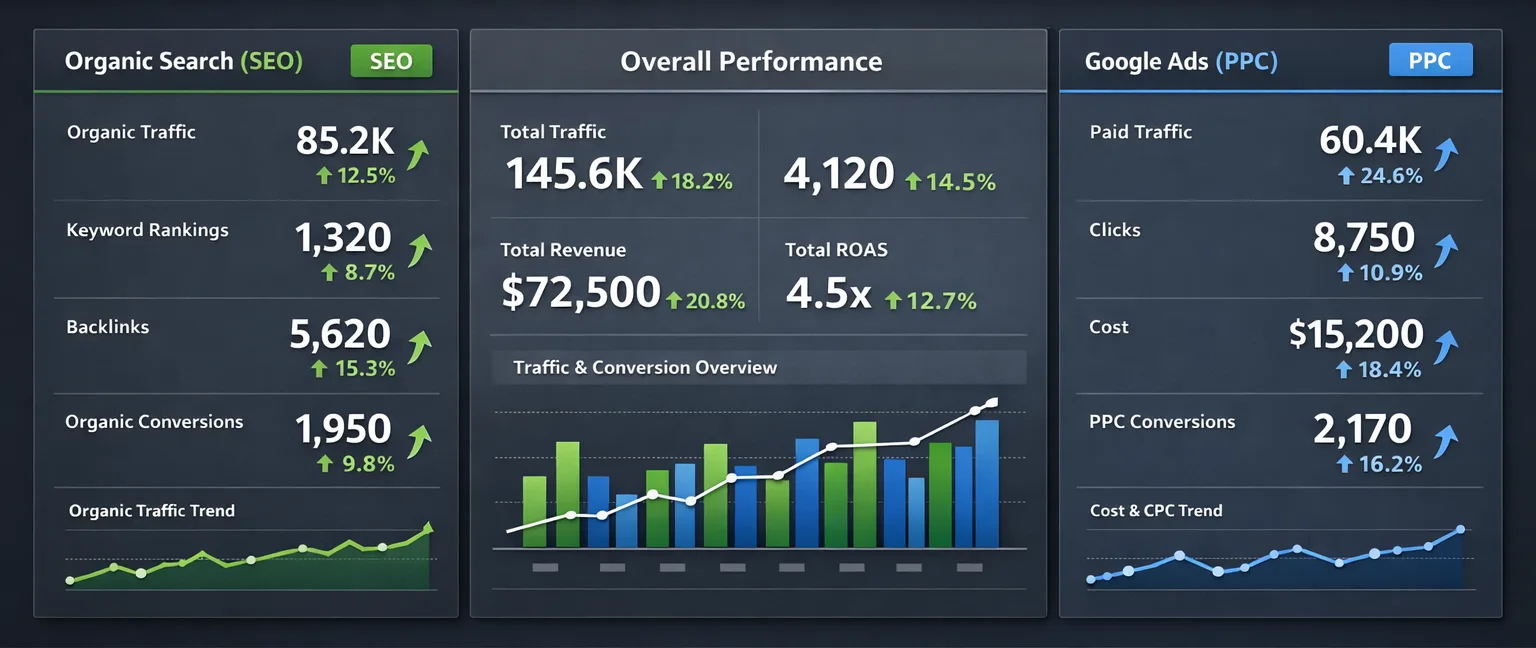
What to Include in a GA4 Client Report
A comprehensive GA4 report should cover traffic overview, traffic sources, user behavior, and conversions at minimum.
Your traffic overview should show total users, sessions, engagement rate, and average engagement time, all with comparison to the previous period. Use a line graph to show traffic trends over time.
The traffic sources section breaks down where visitors came from: organic search, paid search, direct, referral, social, and email. Include both user counts and engagement metrics for each source—not all traffic is created equal.
User behavior examines what visitors did on the site. Top landing pages, most visited pages, and average engagement time by page give insight into content performance. If engagement time is low on important pages, that's a signal to improve content.
Conversions deserve their own section. Show total conversions, conversion rate, and which channels drove the most conversions. If possible, assign value to conversions so you can calculate return on marketing investment.
Using AI Summaries in GA4 Reports
Writing executive summaries for GA4 data is time-consuming, especially when you're managing multiple clients. This is where AI-powered summaries can transform your reporting process.
Modern reporting tools can automatically generate summaries that highlight the most significant changes in GA4 data. Instead of you manually writing "Organic traffic increased 23% while paid traffic decreased 8%," the tool does it for you, freeing you to focus on strategic recommendations.
The key is ensuring these AI summaries still sound like your agency. They should match your tone and highlight the metrics your client cares about most.
Making GA4 Reports Actionable
Data without recommendations is just numbers on a page. Every section of your GA4 report should lead to clear next steps.
If organic traffic increased, note which keywords or pages drove growth and recommend doubling down on similar content. If bounce rate increased on key pages, suggest A/B testing headlines or improving page load speed. If mobile engagement is lower than desktop, recommend mobile optimization.
Your clients aren't paying you just to report numbers. They're paying you to tell them what those numbers mean and what to do about them.
GA4 Reporting Frequency
Most agencies report monthly, but that's not always optimal. High-touch clients might benefit from weekly snapshots during campaigns, while smaller retainer clients might be fine with quarterly deep dives.
The key is consistency. If you commit to monthly reporting, deliver on the same day each month. Predictability builds trust and keeps your agency top-of-mind.
The Future of GA4 Reporting
GA4 is still evolving. Google regularly adds features, adjusts algorithms, and improves reporting capabilities. Staying current ensures your reports remain valuable and your agency stays competitive.
Watch for updates to GA4's machine learning capabilities, which will likely improve predictive metrics and audience insights. These features can provide additional value to clients as they mature.
Simplify Your GA4 Reporting
Sonrai automatically pulls GA4 data into beautifully formatted client reports, complete with AI-powered summaries that highlight key changes. Connect your GA4 properties once and generate professional reports in minutes.
Start your free trial and see how much easier GA4 reporting can be.